Inside SparkFun’s soil sensor: conductivity is not water content
Trace SparkFun’s analog soil sensor from electrodes and transistor to ADC, with PCB analysis, worked calculations, calibration and practical limits.
Contents
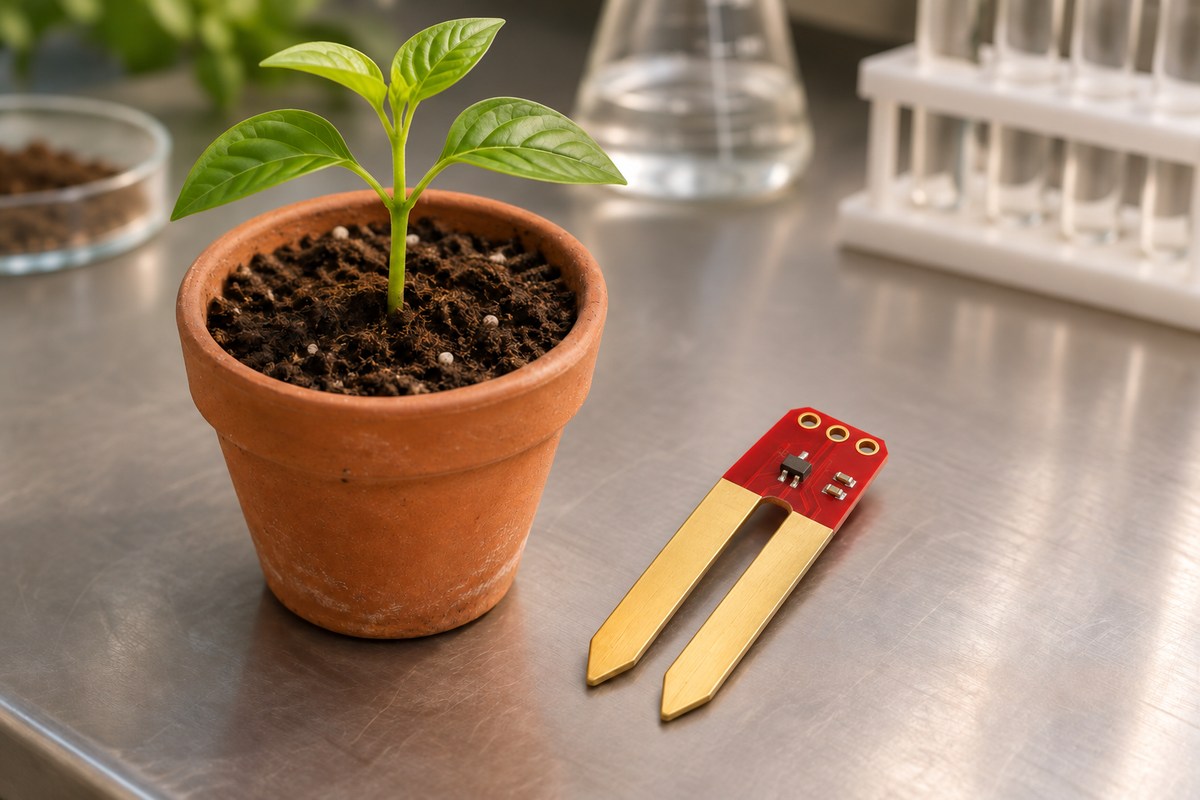
The analog SparkFun Soil Moisture Sensor converts conductivity between two electrodes into a voltage. Wetter soil generally conducts better, but that voltage is not a direct percentage of water content. Its interesting circuit detail is the transistor between the electrodes and the output: this is not simply a soil resistor paired with a fixed resistor in a voltage divider.
The design addresses a modest, useful problem: obtain a changing signal from soil and feed it to a controller's analog input. The board itself has no display, storage, pump or irrigation program. We will follow the path from soil to voltage, numerical reading and decision. A complete automatic watering system requires additional design.
The reviewed revision and board choices
The project belongs to SparkFun Electronics. This review uses Soil_Moisture_Sensor at the pinned revision f4d72d965d0a72b6b031ec2d08d87dd4d307cd76, committed on October 31, 2023, and inspected on November 5, 2026. The Hardware schematic and PCB are the electrical sources. Do not mix this analog board with the Qwiic version containing a microcontroller and I²C interface. The selected repository has no firmware; the host example discussed below is separately documented by the manufacturer.
For this circuit, SEN-13322 comes without fitted screw terminals and SEN-13637 includes them. Choose the connector for your wiring; the Qwiic board with a processor and I²C interface is a different design.
Following the circuit from soil to signal
Two conducting surfaces on the PCB contact the soil. Electrical resistance describes opposition to current and is measured in ohms. We represent the path between the electrodes as a hypothetical resistor, Rsoil. This simplifies the soil and electrode interface; it does not imply that real soil behaves as a constant ideal resistor under every condition.
In the pinned schematic, VCC feeds the 100-ohm resistor R2 and then electrode PROBE2. The other electrode, PROBE1, connects to Q1's base. Q1's collector is on VCC, its emitter is on SIG, and the 10-kilohm R1 connects SIG to ground. A kilohm is one thousand ohms. SIG is a continuously varying voltage; the host needs an analog-to-digital converter, or ADC, to turn it into a number.

An NPN transistor can use a small base current to control a larger current from collector to emitter. Here, the emitter output follows changes in base voltage, a connection called an emitter follower. A more conducting soil path supplies the base more effectively, raising SIG. R1 provides the emitter-current path and pulls the output down without excitation. It is therefore misleading to calculate this as a simple divider consisting only of Rsoil and R1: transistor behavior and base current also matter.
A real ambiguity when rebuilding the board
The CAD value for Q1 says 2N3904, while the library device is MMBT2222A and the footprint is SOT23-3. That device maps base to pad 1, emitter to pad 2 and collector to pad 3; the board's net contacts use the same mapping. The differing names do not establish a circuit defect. They do mean that a rebuild needs the actual fitted component to be identified before purchasing and assembly. The repository does not supply a manufacturer-qualified ordering BOM; a list extracted from CAD values is not equivalent to one.
The Diodes MMBT2222A datasheet, revised June 2025, documents a particular NPN in SOT23, rather than proving that this manufacturer supplied Q1. Current gain and base-emitter voltage depend on operating conditions. Substituting another NPN requires checks of pin mapping, leakage and output response, followed by calibration. Similar appearance and three leads do not establish a drop-in replacement.
What a circuit calculation reveals
Use an explicitly hypothetical model: 3.3 V supply, 0.65 V base-emitter drop, current gain β of 100 and negligible ADC loading. β is collector current divided by base current; emitter current is approximately their sum. With R1 at 10 kilohms and R2 at 100 ohms, the model gives:
Vsig ≈ (Vcc − Vbe) × (β + 1) × R1
       / [Rsoil + R2 + (β + 1) × R1]
Rsoil = 100 kΩ  → Vsig ≈ 2.411 V
Rsoil =   1 MΩ  → Vsig ≈ 1.332 V
A megohm is one million ohms. This explains how a resistance change can become an output-voltage change; 2.411 V is neither a guaranteed board reading nor a known soil-water content. Real β and Vbe are not fixed, and the model omits electrode polarization, leakage and ADC dynamics. If SIG actually measures 2 V, R1 carries 2 V / 10 kΩ = 0.2 mA. That is a branch-current calculation, not a measured supply budget or approval to power the board from any GPIO.
Supply and interface: a pin name is insufficient
The analog board's guide recommends a 3.3–5 V supply. The reviewed schematic shows no regulator, logic-level converter or dedicated input-protection circuit. A 5 V supply therefore does not establish that SIG is safe for every 3.3 V input. Check the ADC's allowed voltage range, shared ground and the sequence in which the two devices receive power. Our 5 V and 3.3 V interfacing lesson develops that decision.
The connector numbers differ: JP1 is 1=VCC, 2=GND, 3=SIG, while screw terminal JP2 is 1=SIG, 2=GND, 3=VCC. These are the actual net and contactref numbers, not an inferred left-to-right view from either side. Wire using the connector drawing and board labels; do not assume pin 1 is positive on both connectors.
The PCB is part of the sensing element
The board file has a 22.86 by 60.96 mm envelope. R1, R2 and Q1 sit near the head, with two long prongs forming the soil interface. Each electrode net has two polygons on layers 1 and 16 and 21 vias. A via provides a conducting connection between layers. Four solder-mask opening polygons appear on layers 29 and 30. These copper areas and openings are functional parts of the sensor; indiscriminately coating them changes the interface being measured.

Keep the electronics above the soil and protect the cable termination against moisture and mechanical strain, while preserving the intended electrode contact. The manufacturer describes an ENIG finish for improved corrosion resistance; CAD alone does not certify the finish or thickness on a purchased specimen. A short SIG route to the ADC and a suitable return path help avoid noise pickup. Pump or motor current does not flow through this board; a pump requires a separately designed power stage.
Host software: power, wait, read, switch off
The basic SparkFun example, attributed to Joel Bartlett in 2015, is separate from the hardware commit. It reads SIG on A0, enables power on D7, waits 10 milliseconds, takes one analogRead sample and switches power off. Its demonstration loop runs approximately once per second.
Switching power off between readings is already in the manufacturer's example, rather than a new feature proposed here. However, its 10 ms wait does not guarantee settling for every cable and ADC. Compare readings at several bounded delays after enabling power and record when they stabilize. A supply switch also needs checks of current capability, voltage drop and back-powering through SIG. GPIO-powered operation requires the actual host's normal and fault budgets to be evaluated.
From raw counts to a decision, without inventing water percentage
An ADC maps voltage into its configured numerical range; the count has no percentage unit by itself. Suppose two repeatable references for the same soil give 200 when dry and 800 at the chosen wet condition. A reading of 600 can be expressed as a relative index:
relative_index = 100 × (raw − dry) / (wet − dry)
100 × (600 − 200) / (800 − 200) ≈ 66.7
Here, 66.7 locates the reading between two chosen references. It does not mean 66.7% volumetric water content. Equal references make the division invalid; a reading outside the calibration interval should be flagged before any display clamping hides it. Salinity, soil type, temperature and density can affect a sensor's relationship with water content; METER's water-content measurement lesson discusses these influences. Scientific or volumetric measurements require appropriate reference measurements and calibration, rather than renaming a count as percent.
Establish decision thresholds using several repeatable conditions in the intended pot and at a consistent insertion depth. Keep raw counts, supply voltage, time since power-on and soil conditions together. The sensor accuracy and calibration lesson explains why a displayed number and a trustworthy measurement are different deliverables.
Proposed improvements and how to evaluate them
A slowly changing plant pot may not need the demonstration's one-second interval. Choose sampling cadence according to the change you must detect. For example, enabling power for 10 ms every 60 seconds gives an on-time fraction of 1/6000, approximately 0.0167%. This is a timing calculation, not a promise that corrosion or battery life improves by the same factor. The tradeoff is slower detection of sudden changes. Record trends with several sampling schedules to evaluate it.
For a long cable or noisy environment, an input filter or buffer is a design candidate. Added capacitance also changes settling and output loading. Instead of prescribing a universal component value, compare SIG at the ADC over several post-power-on delays, then design any modification around that ADC's input requirements. For a hardware rebuild, the first documentation improvement is to resolve Q1's exact ordering MPN in the BOM. This reduces assembly ambiguity but does not replace response testing or calibration.
Bring-up and troubleshooting with evidence
With power removed, verify connector mapping and R1's connection. Apply a compatible current-limited supply, measure VCC and SIG relative to ground, and establish the output range before attaching an ADC. A known resistor across the electrodes can help check circuit repeatability; it is not a soil calibration. Do not use the hypothetical model voltages as production acceptance limits.
A permanent zero may reflect poor contact, an open path, switched-off power or the wrong input pin. A persistent high reading may come from conductive contamination, a short or an interface error. First distinguish the actual SIG voltage from the ADC count; software cannot repair every wiring fault. For fluctuating readings, check supply and contact before choosing a sensor-data filter. Record the result with soil and installation conditions. This is a useful relative-observation tool, rather than a precision moisture instrument certified by the presence of a numerical output.
Project credit: SparkFun Electronics. Hardware is published under CC BY-SA 4.0; adapted diagrams retain that license and identify changes. Calculations and proposed tests are editorial analysis. No circuit construction, soil experiment, lifetime measurement or contribution to the original project is claimed.
Question and answer article
Ask your technical question
Questions and answers are published after moderation. Authors can see their own pending drafts.
No confirmed questions have been registered for this article yet.