How does a soft capacitive sensor turn deformation into a force reading?
Follow a soft pad from deformation to capacitance measurement, calibration and force estimation, with worked examples and the effects of cables, creep and contact conditions.
Contents
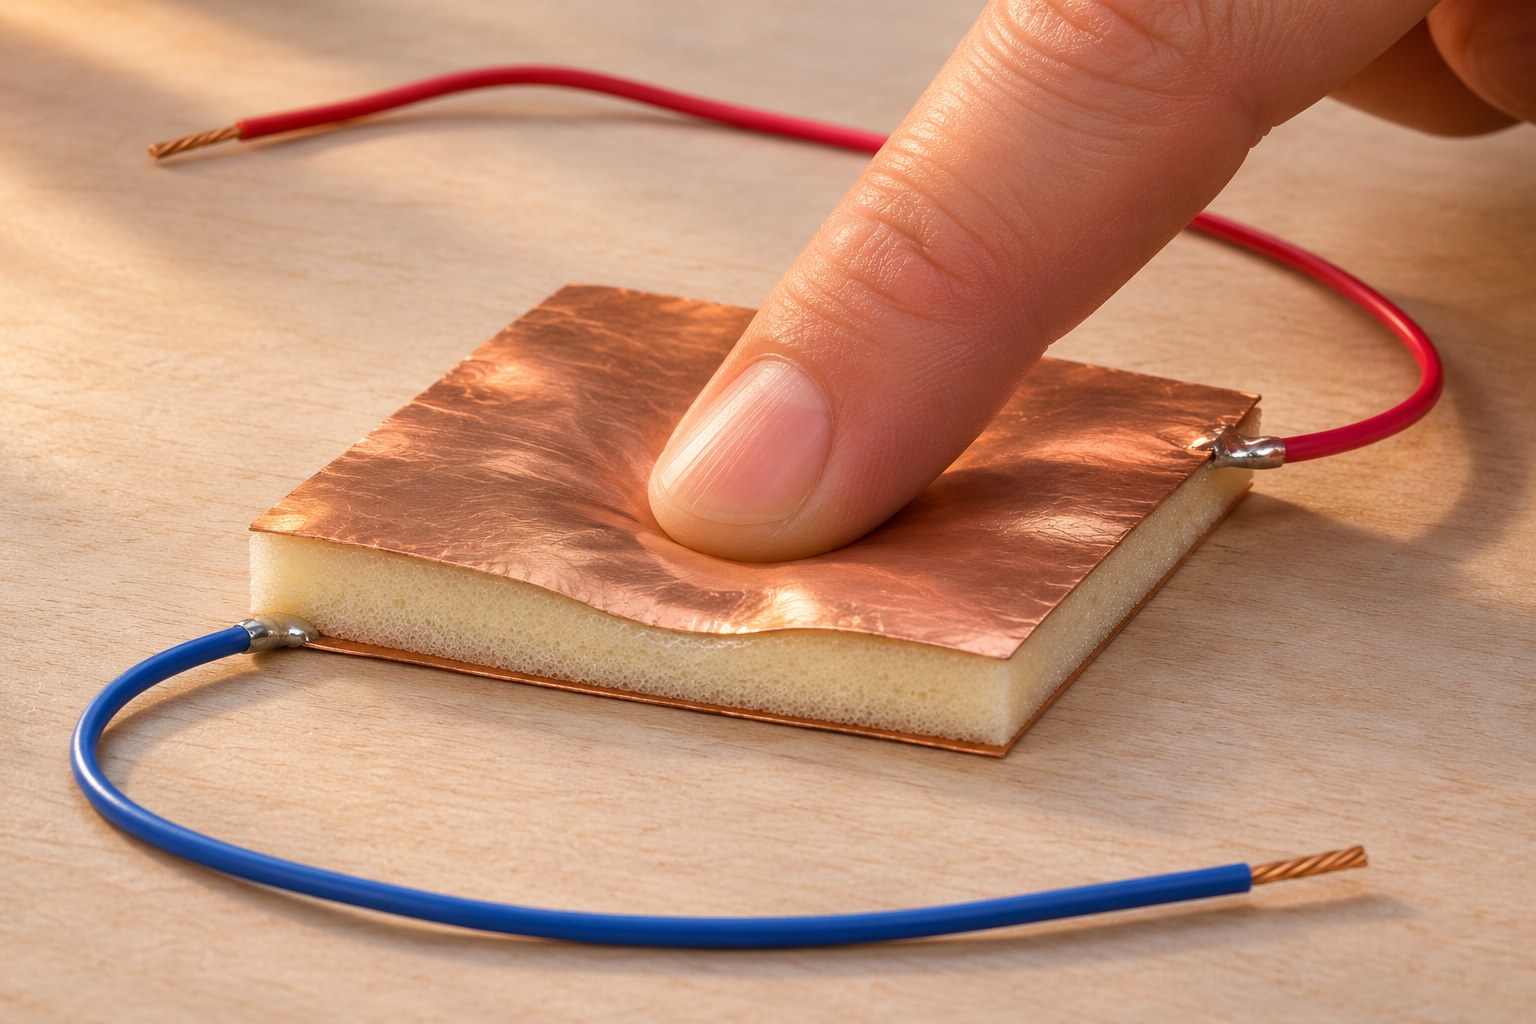
A soft capacitive sensor turns deformation of a flexible structure into a change in electrical capacitance. A readout circuit measures that capacitance. To obtain a result such as “3 newtons,” we also need a relationship between capacitance and applied force, established under the intended mounting conditions. Detecting touch, measuring capacitance and measuring force are three different outputs.
Consider a robot gripper holding a delicate object. Knowing that its finger has made contact is not enough: we need to understand what happens as the gripper squeezes harder. A compliant layer can conform to the object while producing a measurable deformation. The challenge is to distinguish the part of the reading caused by mechanical loading from changes caused by wiring, the environment or the material itself.
Decide which quantity you need
Deformation might mean compression, stretching or bending—for example, a reduction in thickness measured in millimetres. Force describes a push or pull and is measured in newtons, N. Pressure is normal force divided by the area over which it acts, measured in pascals, Pa = N/m². We cannot convert force into pressure without knowing the relevant area.
For example, a hypothetical normal force of 4 N, distributed uniformly over 100 mm² = 0.0001 m², produces an average pressure of 40,000 Pa = 40 kPa. Applying the same force over half the area doubles the average pressure. A fingertip or curved object usually creates an uneven distribution; dividing force by the pad's entire area does not reveal the local pressure map.
What changes inside the soft layer?
A simple structure consists of two conductive surfaces separated by an electrical insulator. Each conductive surface is an electrode; the insulating material between them is the dielectric. The electrodes must remain electrically separated. Capacitance expresses how much charge the structure stores for a given voltage difference. Its unit is the farad; these sensors often involve picofarads, or trillionths of a farad.
For parallel plates, with a separation small relative to the plate dimensions and an approximately uniform field over most of the area, the basic model is:
C ≈ ε₀ × εᵣ × A / d
ε₀ ≈ 8.85 × 10⁻¹² F/m
Here, A is the overlapping area in square metres, d is the separation in metres, and εᵣ is the effective relative permittivity of the intervening material, a dimensionless quantity. Reducing only the separation increases capacitance. In a soft structure, however, area, thickness, air voids and therefore effective permittivity may change together. A capacitance change cannot always be attributed solely to compression. Section 1 of TI's capacitive sensing guide explains the parallel-plate approximation and its edge-field limitation.
Worked example: 20% less separation, how much more capacitance?
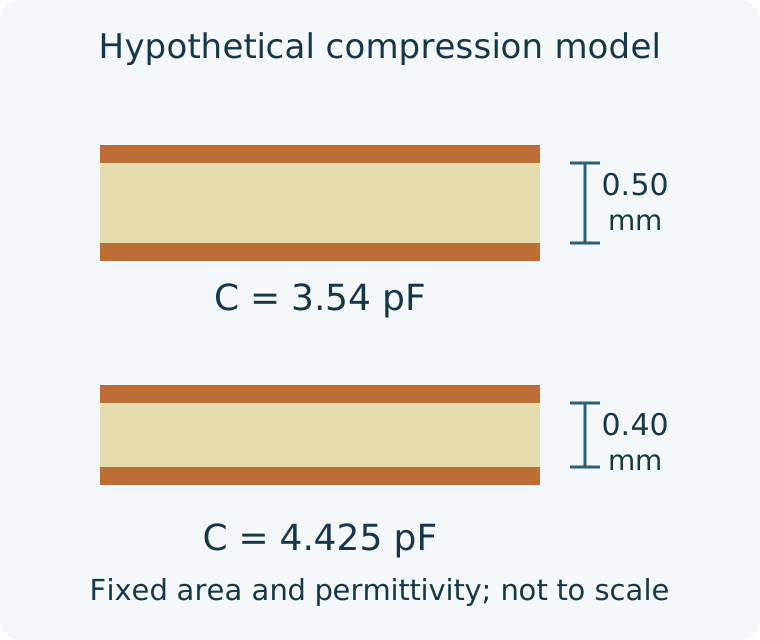
Take hypothetical plates with an overlapping area of 100 mm² and an initial separation of 0.50 mm. For this calculation only, assume a constant εᵣ = 2 and ignore wiring capacitance and edge fields. This is not a specification for the illustrated foam or any particular product.
A = 100 × 10⁻⁶ m²
d₀ = 0.50 × 10⁻³ m
C₀ ≈ 3.54 pF

d₁ = 0.40 × 10⁻³ m
C₁ ≈ 4.425 pF
ΔC = 0.885 pF
ΔC / C₀ = 25%
The gap has decreased by 20%, but capacitance has increased by 25%, because capacitance varies inversely with separation. This calculation does not tell us the force needed to compress the structure. That requires its mechanical behaviour and geometry. Two pads can have the same initial capacitance yet deform differently under the same force.
The circuit reads capacitance; software estimates force
A microcontroller's ordinary voltage input does not automatically return capacitance in picofarads. A readout method must convert the capacitance into something measurable—for example, through controlled charging and discharging, charge transfer, or a dedicated capacitance-to-digital converter. The appropriate method depends on baseline capacitance, expected change, required speed and permissible noise.
Some touch controllers report only whether an electrode is active. That is not a capacitance or force measurement. For example, the CAP1203 board reviewed earlier provides touch events; an active channel must not be interpreted as a value in newtons or pascals. A mechanism that tracks slow baseline changes to keep a touch button working may also be unsuitable for measuring a sustained load. Check the behaviour of the actual readout.
The reading can include more than the pad's capacitance. Wires, PCB traces and nearby objects introduce unwanted capacitance. A useful introductory approximation adds a parasitic capacitance to the sensor capacitance, although real readout circuits can be more complex. Subtracting the initial reading removes only the constant contribution. If cable movement or an approaching hand changes it, initial zeroing is insufficient.
Place the readout close to the sensor and keep the connection short and mechanically stable. Electrical shielding can help, but its connection must suit the readout circuit; connecting every shield to ground is not a universal solution. Section 7 of TI's guide discusses traces, cables and shielding.
From capacitance to force: a model and an independent check
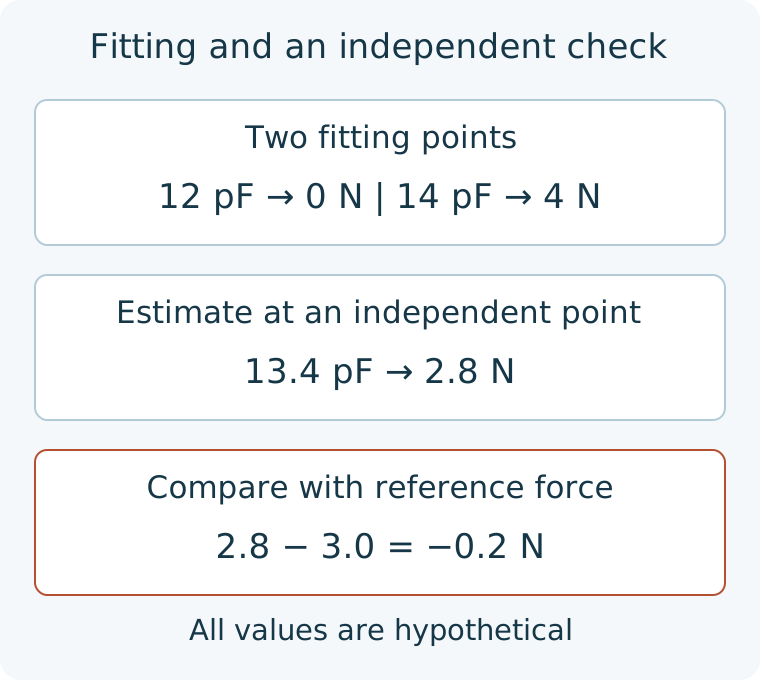
Now consider a separate data-conversion example. Suppose a sensor and readout assembly, under fixed mounting and loading conditions, gives these hypothetical values: total capacitance is 12 pF at zero force and 14 pF at 4 N. These values do not belong to the previous geometry example. Within the range from zero to four newtons, we propose a linear relationship:
F_est = (C − 12 pF) × (4 N / 2 pF)
      = (C − 12 pF) × 2 N/pF
For a reading of 13.4 pF, the model returns 2.8 N. If that reading was obtained at an independent reference force of 3.0 N, the estimate differs from the reference by −0.2 N. If the application permits a maximum difference of 0.1 N under these conditions, the model fails at this point—even though it reproduces its two fitting points exactly.
For a real assembly, apply several known forces across the intended range and reserve some points for independent evaluation from the outset. Record the reference, contact area and position, dwell time, temperature and mounting method. The relationship may not be linear. A lookup table or piecewise model is an improvement only if it performs better on independent data. The sensor calibration lesson explains the distinction between establishing a relationship, correcting a reading and checking its validity.
Why can a constant load produce a changing reading?
Some soft materials continue to deform gradually under a constant load, a behaviour called creep. A reading taken immediately after loading may therefore differ from one taken several seconds later. Recovery after unloading can also take time. In addition, the response while increasing the load may differ from the response while decreasing it. This dependence on loading history is mechanical hysteresis; it is different from using two software thresholds to prevent an alarm from chattering.
Timing is part of the measurement procedure. A model established after a specified dwell time needs separate evaluation before it is used for a rapid impact. Xiao and colleagues' study of a printed soft capacitive sensor examines geometry changes and temporal response for its own structure. Its results are not specifications for every foam or silicone pad.
Before using the reading to make a decision
First define the output, its range and its unit: do you need contact detection, or force estimation with a specified error limit? Evaluate the assembly in its final mounting at several loads, both while increasing and decreasing the load. With load held constant, record changes over time. Then separately examine cable movement and an approaching hand while keeping the mechanical load unchanged. Separating these conditions helps distinguish electrical effects from deformation.
Software should pass only fresh, valid readings within the accepted range to the conversion model. Do not display a communication failure, a saturated readout or stale data as “zero newtons.” If a gripper acts on force feedback, define its response to an invalid sensor in advance; continuing the last command is not necessarily appropriate. Filtering a smoother graph does not repair an incorrect model or changing cable capacitance, and it can delay the response.
The position-sensing lesson explains how capacitance can be related to displacement. Estimating force adds another requirement: understanding mechanical behaviour and contact conditions. A dependable measurement follows a connected path—define the quantity, read capacitance, establish a reference-based relationship, evaluate it independently, then make decisions within its demonstrated limits.
Further reading
- TI, SNOA927A, June 2021 revision: capacitance fundamentals, touch versus sensing, interconnections and shielding.
- Ni, Xue and Li, 2021: a research example connecting mechanical structure, capacitance changes, force and displacement measurement.
- Xiao et al., Advanced Science, 2025: soft sensors, geometry changes and temporal response.
- JCGM 200:2012, International Vocabulary of Metrology: particularly Section 2.39 on calibration.
Question and answer article
Ask your technical question
Questions and answers are published after moderation. Authors can see their own pending drafts.
No confirmed questions have been registered for this article yet.